Offer Amir1,2, Stefan D. Anker3*, Ittamar Gork1, William T. Abraham4, Sean P. Pinney5, Daniel Burkhoff6, Ilan D. Shallom7, Ronit Haviv7, Elazer R. Edelman8 and Chaim Lotan1
1.Department of Cardiology, Hadassah Medical Center, Faculty of Medicine, Hebrew University of Jerusalem, Jerusalem, Israel; 2.Azrieli Faculty of Medicine, Bar-Ilan University, Safed, Israel; 3.Department of Cardiology (CVK) and Berlin Institute of Health Center for Regenerative Therapies (BCRT), German Centre for Cardiovascular Research (DZHK) partner site Berlin, Charité—Universitätsmedizin Berlin, Augustenburger Platz, Berlin, D-13353, Germany; 4.Division of Cardiovascular Medicine, The Ohio State University, Columbus, OH, USA; 5.University of Chicago, Chicago, IL, USA; 6.Cardiovascular Research Foundation, New York, NY, USA; and 7.Cordio Medical Ltd., Or Yehuda, Israel; and 8.Institute for Medical Engineering and Science, MIT, Cambridge, MA, USA
Offer Amir1,2, Stefan D. Anker3*, Ittamar Gork1, William T. Abraham4, Sean P. Pinney5, Daniel Burkhoff6, Ilan D. Shallom7, Ronit Haviv7, Elazer R. Edelman8 and Chaim Lotan1
Abstract
Aims This study aimed to assess the ability of a voice analysis application to discriminate between wet and dry states in chronic heartfailure (CHF) patients undergoing regular scheduled haemodialysis treatment due to volume overload as a result
of their chronic renalfailure.
Methods and results
In this single-centre, observational study, five patients with CHF, peripheral oedema of ≥2, and pulmo-nary congestion-related dyspnoea, undergoing haemodialysis three times per week, recorded five sentences into a standard smartphone/ tablet before and after haemodialysis. Recordings were provided that same noon/early evening and the next morning and evening. Patient weight was measured at the hospital before and after each haemodialysis session. Recordings were analysed by a smartphone application (app) algorithm, to compare speech measures (SMs) of utterances collected over time. On average, patients provided recordings throughout 25.8 ± 3.9 dialysis treatment cycles, resulting in a total of 472 recordings. Weight changes of 1.95 ± 0.64 kg were documented during cycles. Median baseline SM prior to dialysis was 0.87 ± 0.17, and rose to 1.07 ± 0.15following the end of the dialysis session, at noon (P = 0.0355), and remained at a similar level until thefollowing morning (P = 0.007). By the evening of the dayfollowing dialysis, SMs returned to baseline levels (0.88 ± 0.19). Changes in patient weight immediately after dialysis positively correlated with SM changes, with the strongest correlation measured the evening of the dialysis day [slope: -0.40 ± 0.15 (95% confidence interval: -0.71 to -0.10), P = 0.0096].
Conclusions
The fluid-controlled haemodialysis model demonstrated the ability of the app algorithm to identify cyclic
changes in SMs, which reflected bodily fluid levels. The voice analysis platform bears considerable potential as a harbinger of impending fluid overload in a range of clinical scenarios, which will enhance monitoring and triage efforts, ultimately opti-mizing remote CHF management.
Introduction
Heartfailure (HF) can emerge either rapidly or gradually, with minimal or subtle symptomatic eruption in either case before critical decompensation. Evenfrequent and routine assessments oftenfail to predict or alert on imminent fluid overload. New technologies developed to tighten surveillance of pulmonary fluid status include the implantable, wireless pulmonary artery pressure and heart rate monitoring CardioMEMS™ System, indicatedfor patients with New York Heart Association (NYHA) Class III HF with a recent history of hospitalization,1 and intrathoracic impedance-based assess-ment devices.2,3 These technologies though are invasive and generally reservedfor those with severe Class III HF and who have recently been hospitalized. Non-invasive telemedi-cine platforms, which involve synchronous and asynchronous transfer of measured or self-reported parameters (e.g. elec-trocardiogram, blood pressure, body weight, and heart rate), have had conflicting impacts on HF patient care, monitoring, and management, with some reports of no change in all-cause mortality4 or all-cause readmission rates.5,6 Recent advances in voice and sound analysis algorithms have raised
awarenessfor the potential clinical benefits of non-invasively distinguishing speechfeatures in disease settings. Such classifiers have been shown to successfully iden-tify patients sufferingfrom depression, pneumonia–asthma, coronary artery disease, and autism spectrum disorder.7–11 In line with these applications, altered phonation patterns were detected in the context of pulmonary congestion, likely arisingfrom the reduced viscosity of hyperhydrated vocalfold tissue and its consequentially atypical vibration mechanics. Murton et al.12 report on measurable acoustic speech markers indicative of HF status in patients with acute heartfailure (AHF).
The current study exploited the well-controlled volume status in patients with HF undergoing chronic haemodialysis treatments tofurther assess the capacity of the app-based al-gorithm to discriminate significant volume shifts.fluid re-moval leads to lower circulating volume and cardiac fllling pressure after each haemodialysis session, which isfollowed by gradual increases in fluid volume until maximizing just be-fore the next haemodialysis session. Therefore, such patients present a ‘clinical model’for the assessment of the sensitivity of vocal analysis in detecting changes in fluid status. Accord-ingly, fluid status-identifying speech measures (SMs) were analysedfrom voice recordings collected over the course of fluid management with haemodialysis of five patients with chronic HF and haemodialysis-dependent chronic renal failure.
Methods
Patients and study design
This single-centre, observational, single-arm study was approved by the ethics committee of Hadassah Medical Center, Jerusalem, Israel. Adult (>18 years) patients with acute and chronic Class C, NYHA Classes II-IV, congestive HF, undergoing haemodialysis 2-3 times weekly, with a fluid overload of 2-4 L above their currently known dry weight, peripheral oedema of ≥2, and pulmonary congestion-related dyspnoea were eligible to par-ticipate in the study. Patients with significant chronic obstructive pulmonary disease, a congenital heart disease, ev-idence of an active infection or restrictive cardiomyopathy, or constrictive pericarditis were not eligible to participate in the study. Signed informed consent was obtainedfrom each participant. Patients undergoing routine haemodialysis treatment were asked to record five sentences, in their native language (Hebrew or Arabic) into a standard smartphone 3-4 times immediately before (wet state) dialysis. They were then asked to record the sentences an additionalfour times at home: 2-3 hfollowing haemodialysis end (noon/early evening) in the late evening/before bed time, in the morningfollowing dialysis, and before breakfast, and in evening of the dayfollowing dialysis. The duration of each recording was 2-5 s. Patient weight before and after dialysis was recorded to determine the volume of fluid removed during each cycle. Each patient was monitored over multi-dialysis cycles.
Speech analysis application
The HearO™ voice capturing application (Cordio Medical Ltd., Or Yehuda, Israel) runs on a standard smartphone/tablet, and transmits data to an analysis software which executes on a server in the cloud. The analysis algorithm compares SMs between utterances collected at a baseline state and different points of interest. In this study, baseline is the pre-dialysis SM and different points of interest are the post-dialysis SMs (Supporting Information).
Speech analysis
The generation of speech sounds can be modelled as the passage of an excitation signal, originatingfrom the lungs, through a linear filter. The filter represents the shape of the vocal tract, which includes the air pathwaysfrom the glottis upwards to the lips and nostrils.
Speech measure represents the dissimilarity (larger values mean greater dissimilarity) between patient utterances of a reference set R, when the patient was at a baseline physio-logical state, and a test set T, obtained later when the pa-tient’s state may have changed. The method is based on a similarity measure D(t,r) between a test and reference utter-ances, which is a weighted sum of short-term spectral (transformed filter) distortions between non-linear alignedframes in the test and the reference utterances. The SM canformally be defined as
SM (T, R) = medianr ? RD(t, r):
That is,for each test utterances, the similarity measures are computed relative to every one of the reference utter-ances and the median distortion is presented as the representative distortion. The SM between the repeated utterances within each class measures intra-class variability, whereas the SM between the test and the reference classes measures inter-class variability. Thus, if SM(T,R) is signifi-cantly larger than SM(R,R), this indicates a difference be-tween the underlying physiological conditions.
Results
Voice recordings were collectedfrom five patients, each of whom underwent haemodialysis treatments two to three times each week. On average, patients participated through-out 25.8 ± 3.9 dialysis treatment cycles, during which they lost a mean 1.93 ± 0.19 kg. No acute respiratory events or in-flammations were reported throughout the study period. Pa-tients provided a mean 94.4 recordings; in total, 472 recordings were analysed.four patients were male, and one wasfemale; mean patient age was 78.8 ± 7.8 years. In three cases, chronic HF was classified as NYHA 2 and in two cases as NYHA 3. Baseline N-terminal prohormone brain na-triuretic peptide levels averaged 7016.6 ± 3404.0 pg/mL. Co-morbidities included coronary artery disease (n = 3), dia-betes (n = 3), and hypertension (n =4)(Table 1). Mean ± SD of median wet-state SM was 0.87 ± 0.17, which rose to 1.07 ± 0.15 by the end of the dialysis session (noon) and remained at a similar level until thefollowing morning. By the evening of the day after dialysis, mean SM dropped to 0.88 ± 0.19 (Table 2). Similarly,from the MMRM analysis model, the estimate ± standard error (SE) of wet-state SM was 0.982 ± 0.086, which rose to 1.176 ± 0.086 by the end of the dialysis session (noon) and remained at a similar level until thefollowing morning. By the evening of the day after dialysis, mean SM dropped to 0.98 ± 0.086 (Table 3 andfigure 1). There was a statistically significant difference between median SMs measured immediately before vs. immediately after dialysis [-0.19, SE = 0.08, P-value = 0.04, 95% confidence interval (CI): -0.37 to -0.01]. There was also a significant difference between SMs measured immediately before dialysis and those measured thefollowing morning (-0.26, SE = 0.08, P-value = 0.0070, 95% CI: -0.44 to -0.08) (Table 4). Changes in patient weight immediately after dialysis posi-tively correlated with SM changes, with the strongest corre-lation measured the evening of dialysis [slope ± SE: -0.40 ± 0.15 (95% CI: -0.71 to -0.10), P = 0.0096], which paralleled the window in which SM changes were highest and patients were likely driest.
Table 1 Patient demographics and baseline characteristics
| Subject Gender | Age (years) | Race | LVEF (%) | CAD | History of MI | History of CABG/PCI | Diabetes | HT | NT-proBNP (pg/mL) | Blood pressure (mmHg) | NYHA | Concomitant medications |
|---|---|---|---|---|---|---|---|---|---|---|---|---|
| HDS-0001 F | 83 | Caucasian | 70 | No | No | No | No | Yes | 5710 | 166/93 | 3 | Anti-platelet |
| HDS-0003 M | 69 | Caucasian | 24 | Yes | Yes | Yes | Yes | No | 3872 | 136/55 | 2 | Anti-platelet |
| Hyperlipidaemic | ||||||||||||
| Vasodilator | ||||||||||||
| Loop diuretics | ||||||||||||
| HDS-0004 M | 83 | Caucasian | 41–50 | Yes | Yes | No | No | Yes | 5446 | 145/43 | 2 | Anti-platelet |
| Loop diuretics | ||||||||||||
| Hyperlipidaemic | ||||||||||||
| Ca+ channel blocker | ||||||||||||
| HDS-0005 M | 72 | Caucasian | 45–50 | No | No | No | Yes | Yes | 7367 | 130/52 | 2 | Anticoagulant |
| Beta-blocker | ||||||||||||
| Cardiac glycoside | ||||||||||||
| HDS-0006 M | 87 | Caucasian | 50–55 | Yes | Yes | Yes | Yes | Yes | 12 688 | 151/62 | 3 | Ca+ channel blocker |
| ACE inhibitor | ||||||||||||
| Beta-blocker | ||||||||||||
| Anti-platelet | ||||||||||||
| Hyperlipidaemic |
CABG, coronary artery bypass grafting; CAD, coronary artery disease; HT, hypertension; LVEF, left ventricular ejection fraction; MI, myocar-dial infarction; NT-proBNP, N-terminal prohormone brain natriuretic peptide; NYHA, New York Heart Association; PCI, percutaneous cor-onary intervention.
Table 2 Descriptive statistics of median speech measures
| Recording time point | SM (median) | |||||
| N | Mean | SD | Min | Median | Max | |
| Dialysis day morning | 5 | 0.87 | 0.17 | 0.64 | 0.91 | 1.04 |
| Dialysis day noon | 5 | 1.07 | 0.15 | 0.87 | 1.10 | 1.23 |
| Dialysis day evening | 5 | 1.04 | 0.20 | 0.76 | 1.14 | 1.23 |
| Non-dialysis Day 1 morning | 5 | 1.14 | 0.23 | 0.80 | 1.09 | 1.38 |
| Non-dialysis Day 1 evening | 5 | 0.88 | 0.19 | 0.64 | 1.00 | 1.03 |
SD, standard deviation; SM, speech measure.
Table 3 Adjusted means of median speech measures from MMRMa analysis
| Recording time point | Estimate | SE | P-value | Lower 95% CI limit | Upper 95% CI limit |
|---|---|---|---|---|---|
| Dialysis day morning | 0.98 | 0.09 | 0.0027 | 0.68 | 1.28 |
| Dialysis day noon | 1.18 | 0.09 | 0.0017 | 0.88 | 1.47 |
| Dialysis day evening | 1.15 | 0.09 | 0.0018 | 0.85 | 1.44 |
| Non-dialysis Day 1 | 1.24 | 0.09 | 0.0014 | 0.95 | 1.54 |
| morning | |||||
| Non-dialysis Day 1 | 0.99 | 0.09 | 0.0026 | 0.69 | 1.29 |
| evening |
CI, confidence interval; MMRM, mixed model repeated measures;
NT-proBNP, N-terminal prohormone brain natriuretic peptide; SE,standard error.
a Explanatory variables: day and time, age, NT-proBNP, and gender.
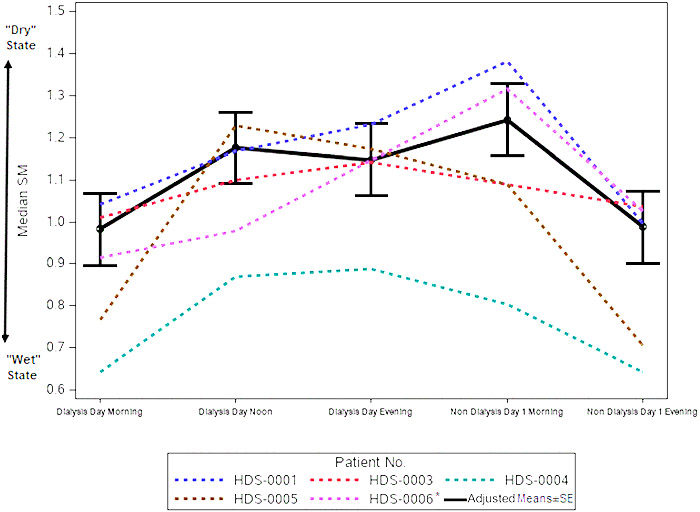
Figure 1 Speech measures (SMs) of acute heart failure patients during haemodialysis cycles. Five chronic heart failure patients undergoing haemodialysis two to three times weekly recorded five sentences using the HearO™ app, before and immediately after dialysis, as well as later that same evening, and the next morning and evening. Median SMs per patient are shown, as well as the adjusted mean ± standard error (SE) SMs, esti-mated from a mixed model repeated measures analysis, which included median SM as the response variable and time, gender, age, and N-terminal prohormone brain natriuretic peptide at baseline as explanatory variables and compound symmetry as variance covariance matrix structure. *Exclud-ing subject HDS-0006 dialysis day evening data that included only three cycles.
Discussion
The present study utilized a highly accessible clinical model to assess the ability of a sound-based algorithm to distinguish between wet and dry states in patients with AHF undergoing haemodialysis. The voice analysis platform identified significant changes in SMs, which paralleled the cyclic haemodialysis treatment-removal fluid patterns. Specifically, pre-dialysis SMs were distinct from those of recordings col-lected immediately after or the morning following treatment. These differences waned with gradual systemic fluid accumu-lation as patients progressed towards their next treatment session. A deviation from this cyclic pattern was consistently noted on the evening of haemodialysis, which may be related to the patients being in their minimal fluid overload on the day of the haemodialysis itself.13 The potential of SMs to inform on pathophysiological states is likely rooted in the hydration-sensitive viscoelastic proper-ties and associated oscillatory behaviour of the vocal fold tis-sue and in respiratory muscle biomechanics. Well-known clinical examples of fluid state-related voice changes include the characteristically deep and hoarse voice of patients with Reinke’s oedema, a condition in which fluid accumulates be-low the outer layer of the vocal cords, subsequently reducing their vibration frequency.14 Similarly, bronchophony, whis-pered pectoriloquy, and egophony15 are common presenta-tions of alveolar or interstitial space fluid overload. Aligning with these are the reports on the negative fluid balance effect of haemodialysis on vocal acoustics parameters,16-19 respira-tory muscle strength and endurance,20 and total lung capacity,21,22 all with bearings on phonation aerodynamics. These effects resonate with the commonly reported transient (≤24 h) post-dialysis hoarseness,23,24 shown to correlate with decreased vocal fold thickness.25 Indeed, in a previous study assessing voice recordings of patients with AHF at hospital ad-mission and at discharge, HearO discriminated between re-cordings collected at admission and those collected at discharge, following intense diuretic treatment and reduction of extracellular fluid. In the current controlled AHF model, the algorithm immediately translated the reduced systemic fluid overload achieved with haemodialysis into discriminating SMs extractable from simple voice recordings. In the context of the increasing attention being placed on remote access technologies of transitional care programmes, this algorithm promises to serve as a valuable monitoring and triage tools in HF management protocols. Such an addition to the expanding alternatives to traditional in-person follow-up visits is expected to advance the global efforts towards opti-mized HF healthcare response and patient care. Several limitations of the current study should be noted. The study tested a small cohort of patients and was a sin-gle-centre, open-label study. In addition, patients with HF on dialysis treatment do not necessarily represent the classi-cal worsening pattern of HF. Nevertheless, as in this unique model, each patient had multiple and separate dialysis cycles, and the data analysed here actually represent a larger cohort. Further studies will be needed to assess the performance of the voice analysis algorithm in larger cohorts of HF patients under less rigorous clinical surveillance. In conclusion, this unique clinical model of patients with HF undergoing haemodialysis assisted in the validation of this smartphone app algorithm and its ability to deploy sophisticated vocal analysis to determine the pulmonary hydration status of pa-tients with Hfl
Table 4 Difference of adjusted means of median speech measures from MMRMa analysis model
| Comparison | Estimate | SE | P-value | Lower 95% CI limit | Upper 95% CI limit |
|---|---|---|---|---|---|
| Dialysis day morning–dialysis day noon | -0.19 | 0.08 | 0.04 | -0.37 | -0.01 |
| Dialysis day morning–dialysis day evening | - 0.17 | 0.08 | 0.069 | 0.34 | 0.01 |
| Dialysis day morning–non-dialysis Day 1 morning | 0.26 | 0.08 | 0.0070 | -0.44 | -0.08 |
| Dialysis day morning–non-dialysis Day 1 evening | -0.01 | 0.08 | 0.94 | -0.19 | 0.17 |
| Dialysis day noon–dialysis day evening | 0.03 | 0.08 | 0.74 | -0.15 | 0.21 |
| Dialysis day noon–non-dialysis Day 1 morning | -0.07 | 0.08 | 0.44 | -0.25 | 0.11 |
| Dialysis day noon–non-dialysis Day 1 evening | 0.19 | 0.08 | 0.041 | 0.01 | 0.37 |
| Dialysis day evening–non-dialysis Day 1 morning | -0.10 | 0.08 | 0.27 | -0.27 | 0.08 |
| Dialysis day evening–non-dialysis Day 1 evening | 0.16 | 0.08 | 0.078 | -0.02 | 0.34 |
CI, confdence interval; MMRM, mixed model repeated measures; NT-proBNP, N-terminal prohormone brain natriuretic peptide; SE, stan-dard error. aExplanatory variables: day and time, age, NT-proBNP, and gender.
Conflict of interest
O.A. is a paid consultant to Cordio Medical Ltd. S.D.A. reports receiving grant support from Abbott and Vifor Pharma and fees from Abbott, Bayer, Boehringer Ingelheim, Cardiac Di-mension, Impulse Dynamics, Novartis, Servier, and Vifor Pharma and is a consultant to Cordio Medical Ltd. I.G. has no interest to declare. W.T.A. is a consultant to Cordio Medical Ltd. and has received consulting fees from Abbott, Boehringer Ingelheim, CVRx, Edwards Lifesciences, and Respicardia; salary support from V-Wave Medical; and research support from the US National Institutes of Health/National Heart, Lung, and Blood Institute. S.P.P. is a consultant to Cordio Medical Ltd. and has received consulting fees from Abbott, CareDx, Medtronic, NuPulse, and Procyrion. D.B. is a consultant to
Cordio Medical Ltd. I.D.S. is the Chief Technology Officer of Cordio Medical Ltd. R.H. is the Clinical SrVP at Cordio Medical Ltd. E.R.E. is supported in part by a grant from the US National Institutes of Health (NIH R01 49039) and is a paid consultant to Cordio Medical Ltd. C.L. is a board member of Cordio Medical Ltd. and receiving lecture fees from Boehringer Ingelheim.
Funding
This work was supported by Cordio Medical Ltd.
Supporting information
Additional supporting information may be found online in the Supporting Information section at the end of the article.
Data S1. Supporting Information.
References
- Abraham WT, Adamson PB, Bourge RC, Aaron MF, Costanzo MR, Stevenson LW, Strickland W, Neelagaru S, Raval N, Krueger S, Weiner S, Shavelle D, Jeffries B, Yadav JS, CHAMPION Trial Study Group. Wireless pulmonary ar-tery haemodynamic monitoring in chronic heart failure: a randomised con-trolled trial. Lancet 2011; 377: 658–666.
- Sasaki S, Ishida Y, Kinjo T, Itoh T, Horiuchi D, Sasaki K, Owada S, Kimura M, Okumura K. Telediagnosis of heart failure with continuous intrathoracic im-pedance monitoring by medtronic carelink network: importance of the ele-vation pattern of optivol fluid index. J Arrhythmia 2013; 29:347–352.
- Yang XW, Hua W, Ding LG, Wang J, Zheng LH, Li CQ, Liu ZM, Chen KP, Zhang S. Optivol fluid index predicts acute decompensation of heart failure with a high rate of unexplained events. J Geriatr Cardiol 2013; 10: 253–257.
- Koehler F, Winkler S, Schieber M, Sechtem U, Stangl K, Bohm M, Boll H, Baumann G, Honold M, Koehler K, Gelbrich G, Kirwan BA, Anker SD, Telemedical Interventional Monitoring in Heart Failure I. Impact of remote telemedical management on mortality and hospitalizations in ambulatory pa-tients with chronic heart failure: the telemedical interventional monitoring in heart failure study. Circulation 2011; 123:1873–1880.
- Chaudhry SI, Mattera JA, Curtis JP, Spertus JA, Herrin J, Lin Z, Phillips CO, Hodshon BV, Cooper LS, Krumholz HM. Telemonitoring in patients with heart failure. N Engl J Med 2010; 363: 2301–2309.
- Ong MK, Romano PS, Edgington S, Aronow HU, Auerbach AD, Black JT, De Marco T, Escarce JJ, Evangelista LS, Hanna B, Ganiats TG, Greenberg BH, Greenfield S, Kaplan SH, Kimchi A, Liu H, Lombardo D, Mangione CM, Sadeghi B, Sadeghi B, Sarrafzadeh M, Tong K, Fonarow GC, Better Effectiveness After Transition–Heart Failure (BEAT-HF) Re-search Group. Effectiveness of remote patient monitoring after discharge of hospitalized patients with heart failure: the Better Effectiveness After Transition–Heart Failure (BEAT-HF) randomized clinical trial. JAMA Intern Med 2016; 176:310–318.
- Amrulloh Y, Abeyratne U, Swarnkar V, Triasih R. Cough sound analysis for pneumonia and asthma classification in pediatric population. 6th International Conference on Intelligent Systems, Model-ling and Simulation. 2015:127–39.
- Bonneh YS, Levanon Y, Dean-Pardo O, Lossos L, Adini Y. Abnormal speech spec-trum and increased pitch variability in young autistic children. Front Hum Neurosci 2011; 4:237.
- He L, Cao C. Automated depression analysis using convolutional neural net-works from speech. J Biomed Inform 2018; 83:103–111.
- Kosasih K, Abeyratne UR, Swarnkar V, Triasih R. Wavelet augmented cough analysis for rapid childhood pneumonia diagnosis. IEEE Trans Biomed Eng 2015; 62:1185–1194.
- Maor E, Sara JD, Orbelo DM, Lerman LO, Levanon Y, Lerman A. Voice signal characteristics are independently associ-ated with coronary artery disease. Mayo Clin Proc 2018; 93: 840–847.
- Murton OM, Hillman RE, Mehta DD, Semigran M, Daher M, Cunningham T, Verkouw K, Tabtabai S, Steiner J, Dec GW, Ausiello D. Acoustic speech analysis of patients with decompensated heart failure: a pilot study. J Acoust Soc Am 2017; 142: EL401–EL407.
- Firsov D, Bonny O. Circadian rhythms and the kidney. Nat Rev Nephrol 2018; 14: 626–635.
- Zeitels SM, Hillman RE, Bunting GW, Vaughn T. Reinke’s edema: phonatory mechanisms and management strate-gies. Ann Otol Rhinol Laryngol 1997; 106: 533–543.
- Sarkar M, Madabhavi I, Niranjan N, Dogra M. Auscultation of the respiratory system. Ann Thorac Med 2015; 10: 158–168.
- Hamdan AL, Medawar W, Younes A, Bikhazi H, Fuleihan N. The effect of hemodialysis on voice: an acoustic anal-ysis. J Voice 2005; 19: 290–295.
- Jung SY, Ryu JH, Park HS, Chung SM, Ryu DR, Kim HS. Voice change in end-stage renal disease patients after he-modialysis: correlation of subjective hoarseness and objective acoustic pa-rameters. J Voice 2014; 28: 226–230.
- Sagiroglu S, Doganer A. The effect of electrolyte balance on the voice in hemodialysis patients. Eur Arch Otorhinolaryngol 2018; 275: 2755–2761.
- Unver S, Hardal U, Esertas K, Sezen A, Celikbilek F, Altundag A. Objective analysis of voice changes in a hemodi-alysis session and its correlation with ultrafiltration. Ren Fail 2015; 37: 268–272.
- Weiner P, Zidan F, Zonder HB. Hemodi-alysis treatment may improve inspira-tory muscle strength and endurance. Isr J Med Sci 1997; 33:134–138.
- Metry G, Wegenius G, Hedenstrom H, Wikstrom B, Danielson BG. Computed tomographic measurement of lung density changes in lung water with hemodialysis. Nephron 1997; 75: 394–401.
- Karki A, Riley L, Mehta HJ, Ataya A. Pleural effusions of urinary etiologies. Dis Mon 2019; 65:104–108.
- Zumrutdal A. An overlooked complication of hemodialysis: hoarseness. Hemo-dial Int 2013; 17: 633–638.
- Santhirakumar M, Phua CQ, Karagama Y. Hoarseness secondary to haemo-dialysis: case report and literature re-view. J Laryngol Otol 2012; 126: 867–869.
- Ori Y, Sabo R, Binder Y, Weinstein T, Korzets A, Ori G, Gafter U, Chagnac A. Effect of hemodialysis on the thickness of vocal folds: a possible explanation for postdialysis hoarseness. Nephron Clin Pract 2006; 103:c144–c148.